Case Study: Rain Event Analysis- Ashkelon Flooding

Case Study: Rain Event Analysis- Ashkelon Flooding
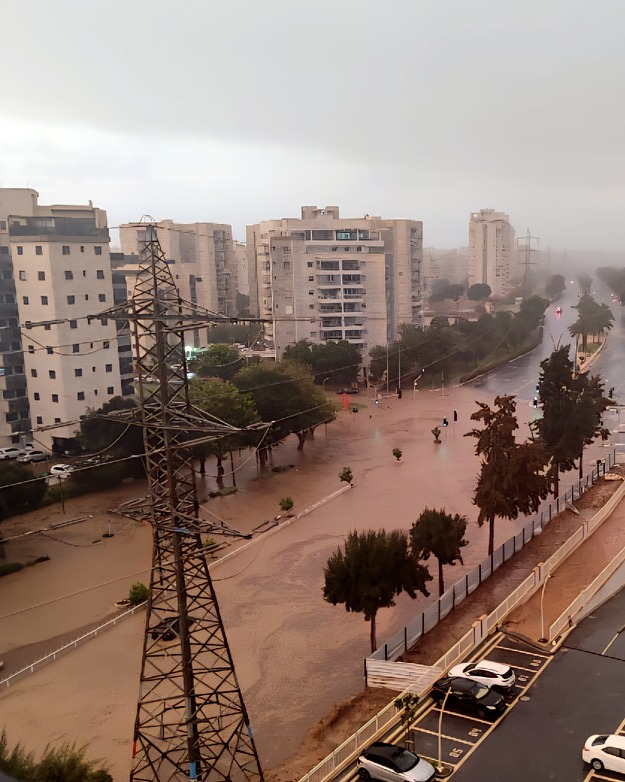
November 14, 2025 - Hydrological analysis
This analysis documents an extreme rainfall event that caused significant urban flooding in Ashkelon. Peak intensity reached 15.3 mm in 10 minutes (91.8 mm/hr equivalent).
Executive Summary
On November 14, 2025, Ashkelon Port experienced a rainfall event that overwhelmed urban drainage systems and caused widespread flooding. The event delivered 68.9 mm of rain with the majority falling in just 2.0 hours, peaking at an extraordinary intensity that exceeded the design capacity of most urban infrastructure.
Data at a Glance
| Metric | Value |
|---|---|
| Total Rainfall | 68.9 mm |
| Peak 10-min Intensity | 15.3 mm |
| Peak Hourly Rate | 91.8 mm/hr |
| Main Event Duration | 2.0 hours |
| Time to Peak | 60 minutes |
Observed vs Design IDF table with Est. return period on last column
| Duration | Observed | 2-yr | 5-yr | 10-yr | 20-yr | 25-yr | 50-yr | 100-yr | 200-yr | 500-yr | Est. Return Period |
|---|---|---|---|---|---|---|---|---|---|---|---|
| 10 min | 15.3 | 6.1 | 8.4 | 10.1 | 12.0 | 12.6 | 14.6 | 16.8 | 19.3 | 22.9 | ~70 years |
| 15 min | 22.8 | 7.5 | 10.3 | 12.4 | 14.7 | 15.5 | 17.9 | 20.6 | 23.7 | 28.1 | ~180 years |
| 20 min | 28.4 | 8.4 | 11.7 | 14.1 | 16.8 | 17.6 | 20.4 | 23.5 | 27.0 | 32.0 | ~270 years |
| 30 min | 35.8 | 10.5 | 14.7 | 17.7 | 21.0 | 22.0 | 25.5 | 29.4 | 33.8 | 40.0 | ~230 years |
| 45 min | 48.1 | 12.5 | 17.5 | 21.0 | 25.0 | 26.3 | 30.4 | 35.0 | 40.3 | 47.8 | ~500 years |
| 60 min | 59.7 | 14.0 | 20.0 | 24.5 | 29.0 | 30.5 | 35.3 | 40.5 | 46.5 | 55.3 | >500 years |
| 90 min | 63.2 | 16.5 | 23.5 | 29.0 | 34.5 | 36.3 | 42.0 | 48.0 | 55.0 | 65.0 | ~450 years |
| 120 min | 64.4 | 19.0 | 26.5 | 32.5 | 39.0 | 41.0 | 47.3 | 54.5 | 62.5 | 74.0 | ~150 years |
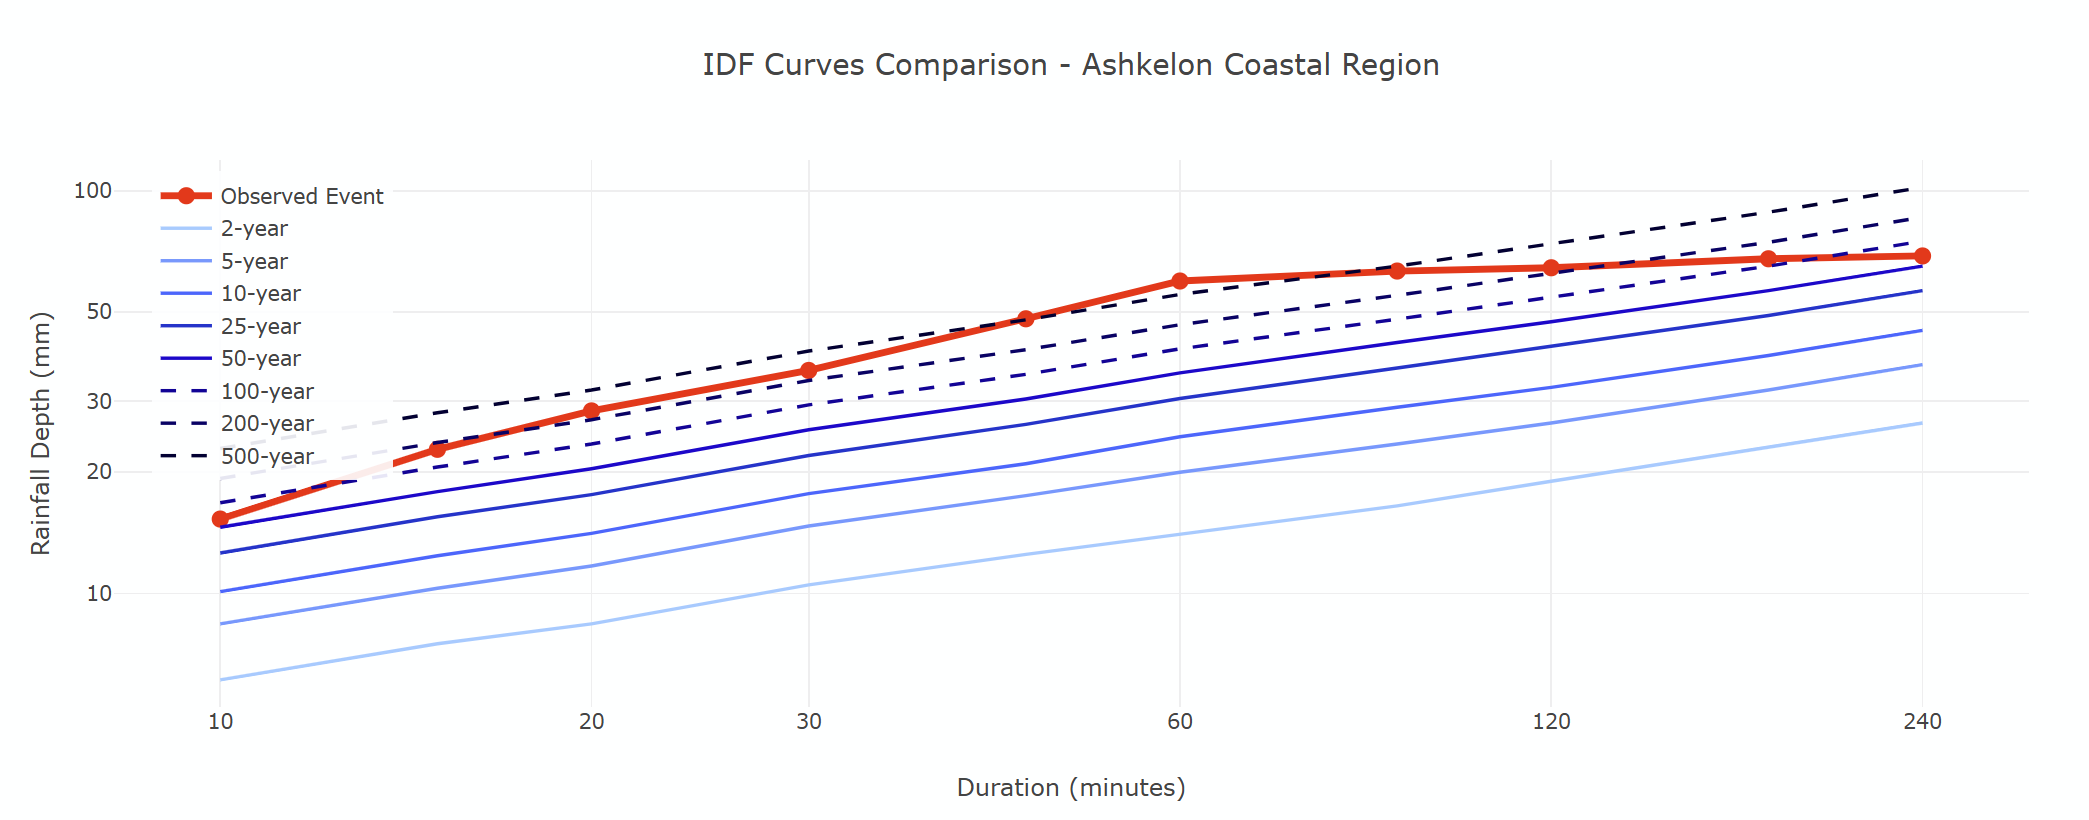 Figure 1: IDF curves comparison
 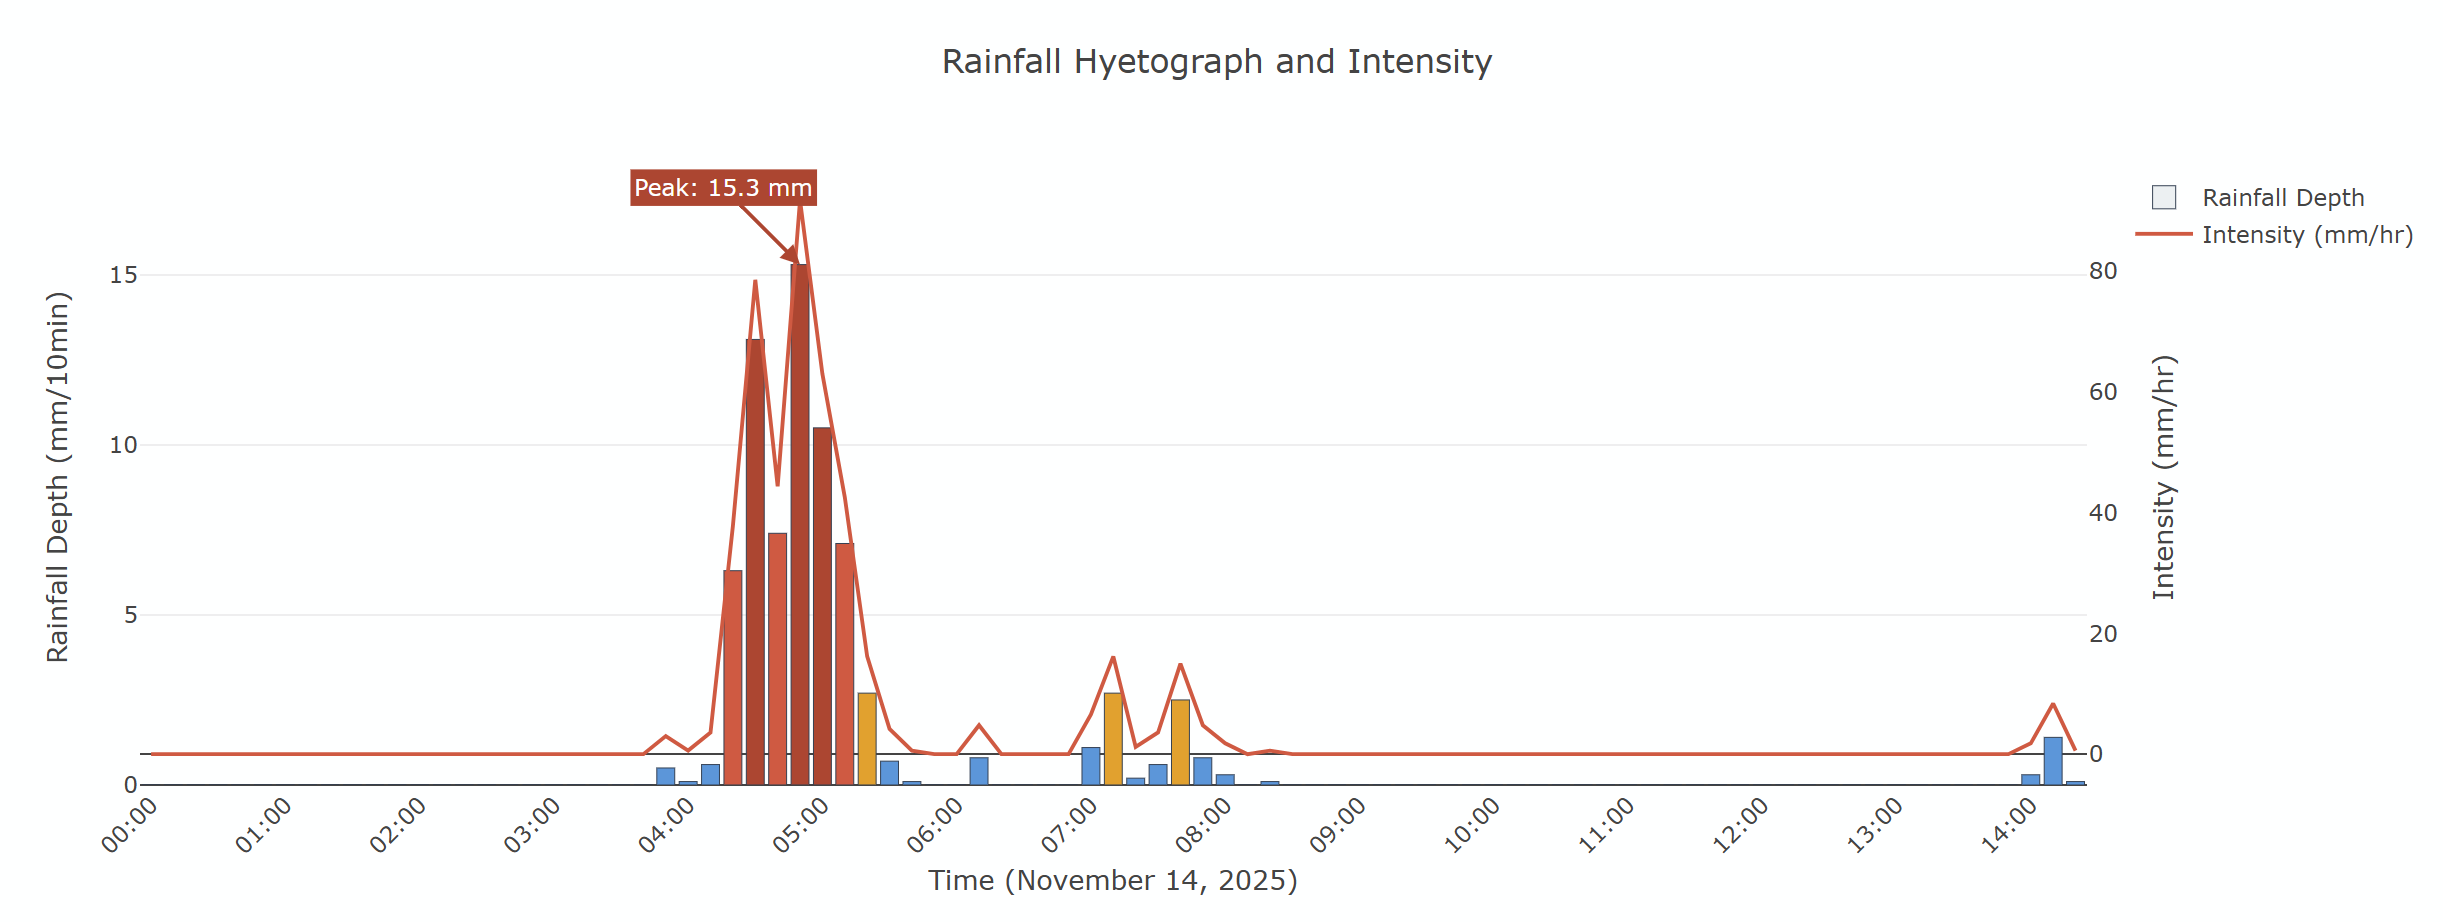 Figure 2: Rainfall Hyetograph and intensity
Rainfall Analysis Visualizations
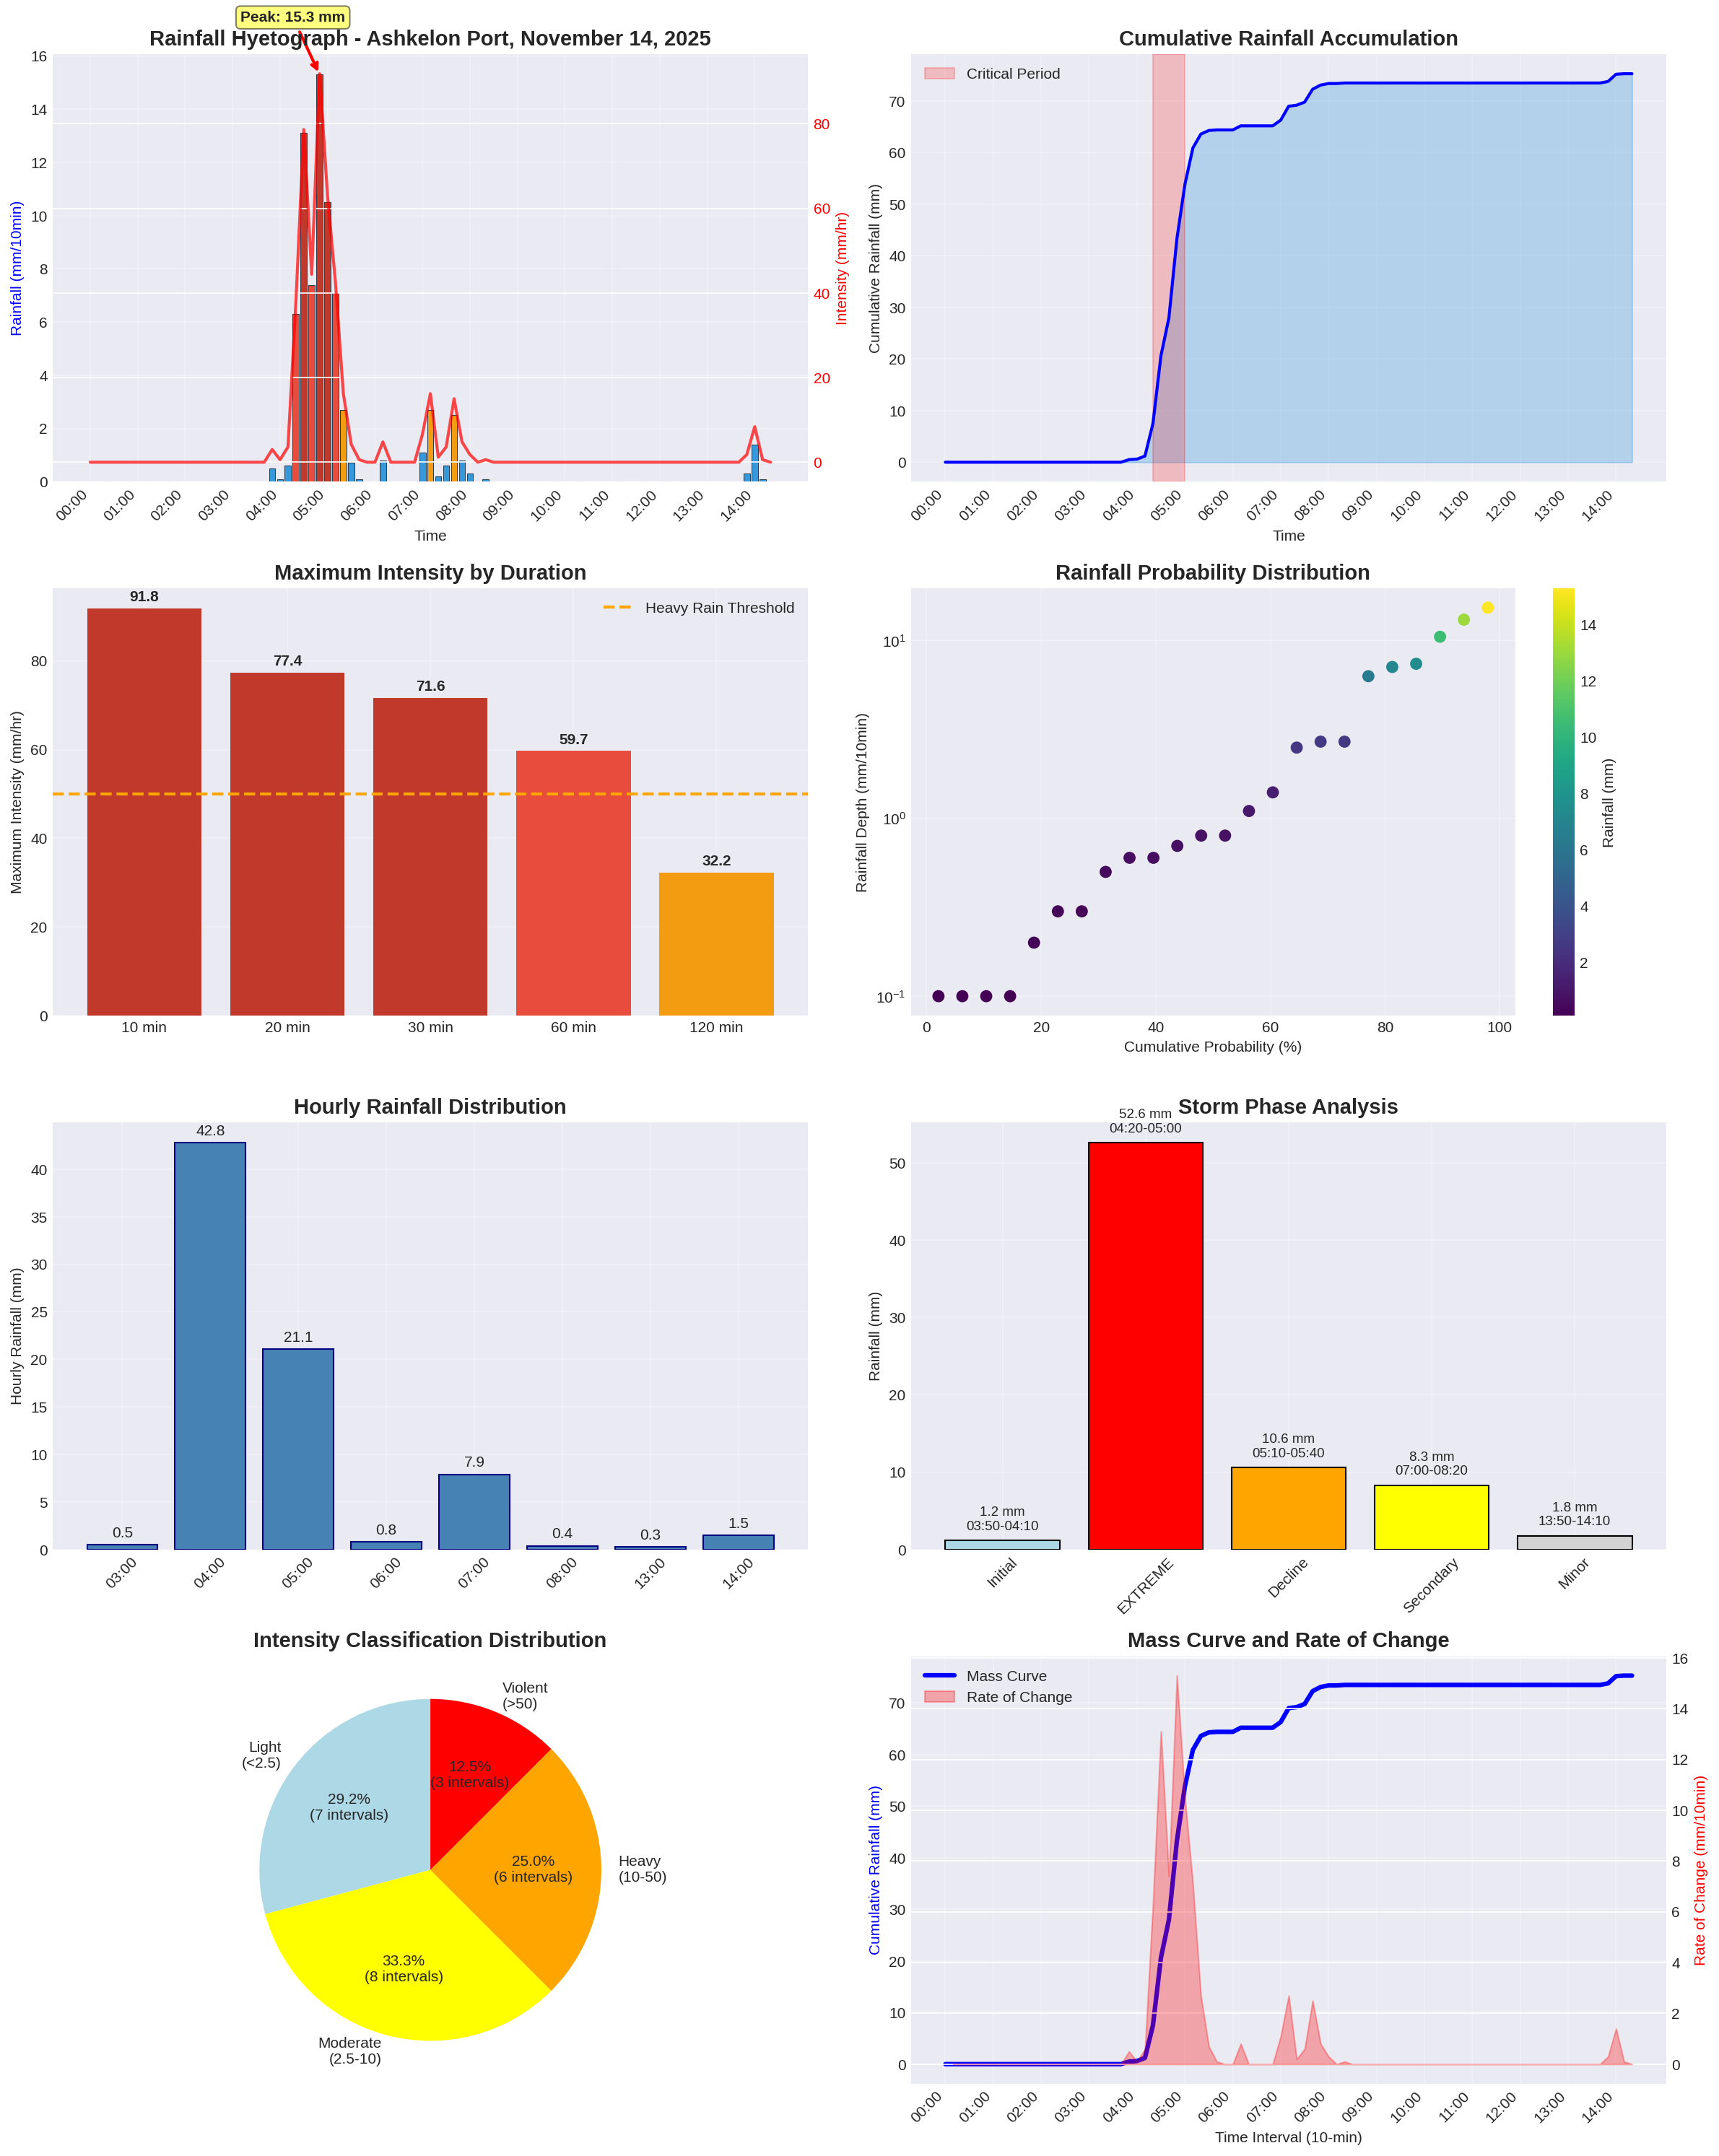
Figure 3: Comprehensive analysis showing hyetograph, cumulative rainfall, intensity patterns, probability distribution, hourly distribution, storm phases, intensity classification, and mass curve analysis (click to make the picture bigger)
Detailed Hydrological Analysis
Why This Event Caused Severe Flooding
Extreme Short-Duration Intensity
The 15.3 mm falling in just 10 minutes exceeds most urban drainage design standards, which typically accommodate 10–20-year events. This intensity is equivalent to 91.8 mm/hr.
However, the peak burst did not occur in isolation. The dataset shows a rapid buildup of rainfall in the 20–30 minutes leading up to the peak, including consecutive intensities of 6.3 mm, 13.1 mm, and 7.4 mm, which already saturated surfaces and primed the drainage system before the extreme 10-minute spike. Following the peak, the system continued receiving significant amounts—10.5 mm, 7.1 mm, and additional rainfall over the next half hour—meaning the runoff volume accumulated over an extended period. This combination of pre-peak loading, an extreme short-duration maximum, and post-peak continuation creates a compounded hydrological burden far greater than what is captured by only analyzing the 10-minute intensity itself.
Rapid Rate
Intensity increased from 0.6 to 15.3 mm/10min in just 30 minutes, providing no time for:
- Drainage systems to adapt or pre-empty
- Emergency response mobilization
- Public warning dissemination
Conclusions
This event represents a “perfect storm” scenario for urban flooding:
- Extreme intensity exceeding infrastructure design standards
- Front-loaded temporal pattern providing minimal response time
- Sustained attack preventing system recovery
- Morning timing coinciding with peak urban activity
The analysis reveals that current urban drainage infrastructure, designed for 5-10 year events, is inadequate for managing extreme rainfall intensities becoming more frequent with climate change. Immediate implementation of both structural and non-structural measures is essential to build resilience against future events.
Key Takeaways
- Design Storm Revision: Current 5-10 year standards are insufficient
- Short-Duration Focus: 10-30 minute intensities are critical for urban flooding with addition to added rain volume.
- Dual Drainage Necessity: Both pipe and overland flow paths are essential
- Green Infrastructure Value: Could mitigate first 20-30 mm significantly
- Early Warning Critical: 15-minute lead time could prevent casualties and damage.
Analysis conducted using 10-minute interval rainfall data from Ashkelon Port meteorological station. This forensic hydrological assessment provides insights for improving urban flood resilience and updating design standards for extreme weather events.
Data & Methodology
Data Source: Ashkelon Port Rain Gauge Station
Temporal Resolution: 10-minute intervals
Analysis Methods: IDF analysis. Software: Python (pandas, numpy, scipy, matplotlib)
Standards Referenced: Israeli drainage design guidelines, WMO intensity classifications